
Langland Bay
★★★★★SmallBest of the week: Friday around 06:00, 6–8 ft and offshore.
Live webcam
Gower LiveOpen the Langland Bay cam by Gower Live. Opens in a new tab.
Seven days
best session each day · swipe| Sun 15 | Mon 16 | Tue 17 | Wed 18 | Thu 19 | Fri 20 | |||||||||||||||||||||||||
|---|---|---|---|---|---|---|---|---|---|---|---|---|---|---|---|---|---|---|---|---|---|---|---|---|---|---|---|---|---|---|
| Time | 06 | 09 | 12 | 15 | 18 | 06 | 09 | 12 | 15 | 18 | 06 | 09 | 12 | 15 | 18 | 06 | 09 | 12 | 15 | 18 | 06 | 09 | 12 | 15 | 18 | 06 | 09 | 12 | 15 | 18 |
| Surf ft | 2–3 | 2–3 | 2–3 | 2–3 | 2–4 | 3–4 | 3–4 | 2–4 | 3–4 | 3–5 | 4–6 | 5–8 | 6–8 | 8–11 | 8–11 | 12–17 | 14–18 | 14–19 | 13–18 | 12–16 | 9–12 | 9–12 | 9–13 | 9–12 | 8–11 | 6–8 | 5–7 | 5–7 | 4–6 | 4–5 |
| Swell | 7s | 3s | 7s | 6s | 7s | 8s | 9s | 9s | 8s | 4s | 5s | 6s | 6s | 10s | 10s | 11s | 12s | 11s | 12s | 11s | 11s | 11s | 11s | 12s | 11s | 10s | 10s | 10s | 9s | 9s |
| Wind mph | 13 | 10 | 6 | 8 | 15 | 8 | 7 | 5 | 15 | 25 | 12 | 14 | 15 | 13 | 11 | 8 | 7 | 10 | 10 | 9 | 9 | 9 | 9 | 12 | 12 | 7 | 4 | 4 | 3 | 2 |
| Tide m | 5.4↑ | 7.9↑ | 5.7↓ | 3.0↓ | 4.8↑ | 4.7↑ | 7.3↑ | 6.5↓ | 3.6↓ | 4.2↑ | 4.2↑ | 6.5↑ | 7.0↓ | 4.6↓ | 3.7↑ | 3.8↑ | 5.5↑ | 7.1↑ | 5.7↓ | 3.6↓ | 3.9↓ | 4.4↑ | 6.9↑ | 6.8↓ | 4.0↓ | 4.4↓ | 3.3↑ | 6.2↑ | 7.8↓ | 4.9↓ |
| Rating | ★★★★★ | ★★★★★ | ★★★★★ | ★★★★★ | ★★★★★ | ★★★★★ | ★★★★★ | ★★★★★ | ★★★★★ | ★★★★★ | ★★★★★ | ★★★★★ | ★★★★★ | ★★★★★ | ★★★★★ | ★★★★★ | ★★★★★ | ★★★★★ | ★★★★★ | ★★★★★ | ★★★★★ | ★★★★★ | ★★★★★ | ★★★★★ | ★★★★★ | ★★★★★ | ★★★★★ | ★★★★★ | ★★★★★ | ★★★★★ |
Surf is the face height at the beach after the swell is filtered for the way Langland Bay faces. Arrows point to where the swell and wind come from: an arrow pointing up means from the north. Tide is the height at Mumbles above chart datum, rising ↑ or falling ↓; the rating drops when the tide is outside the window this break works on. Amber marks the sessions worth setting an alarm for. From Wednesday the swell comes from Météo-France's 10-day model, which is coarser than the 5 km German model used close in. Hours no model reaches are left blank, not shown as flat.
Exposure
Langland Bay faces south. Measured from the seabed, it is open to swell from E round to W; the brighter a wedge, the deeper the water in that direction and the more of the swell gets in. Anything from behind the headlands scores nothing, however big the buoy says it is.
- SW
- 0.7 m at 7 s (swell) · 100 % reaches the beach
- SE
- 0.6 m at 3 s (wind sea) · 100 % reaches the beach
How Langland Bay works
- Swell
- Best from the south west.
- Wind
- Offshore is from the north; anything with south in it is onshore and messes it up.
- Tide
- low to mid tide.
- Getting there
- Just down the coast from swansea
Loads of breaks through various tides.. Beach break at high, with reefs available the both ends at low.
Tide times
- Sun 02:42Low2.8 m
- Sun 09:14High8.0 m
- Sun 15:12Low3.0 m
- Sun 21:34High7.5 m
- Mon 03:20Low3.2 m
- Mon 09:58High7.6 m
- Mon 16:03Low3.3 m
- Mon 22:23High7.2 m
Mumbles station, 3 km away. Heights above chart datum, UK time.
Photos
In the gallery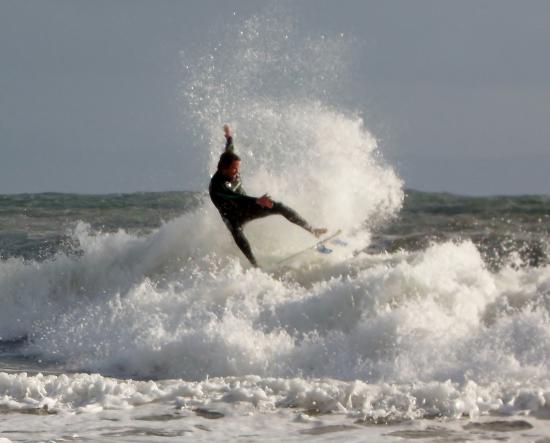
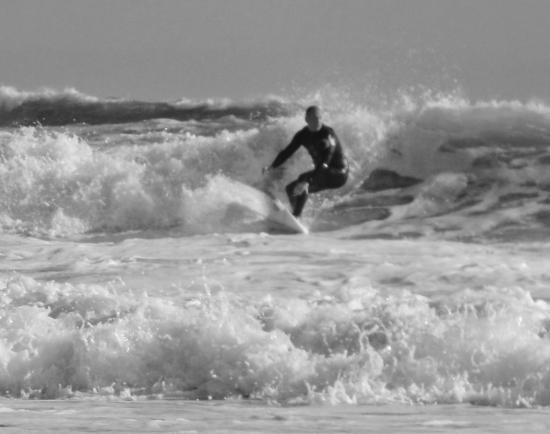
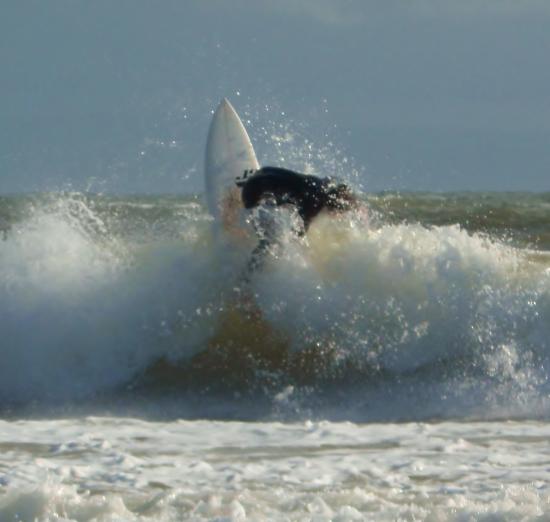
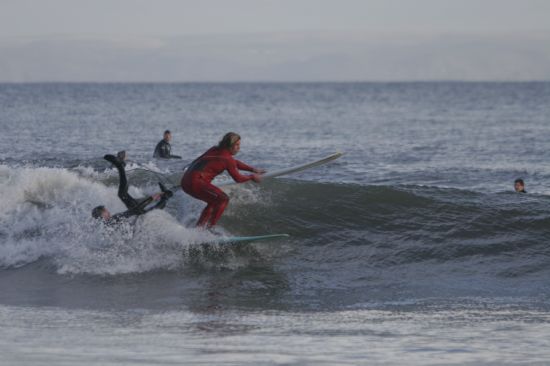
Members' own photos of Langland Bay. Credits: Becklett, dave jones.
Comments
Nearby
-
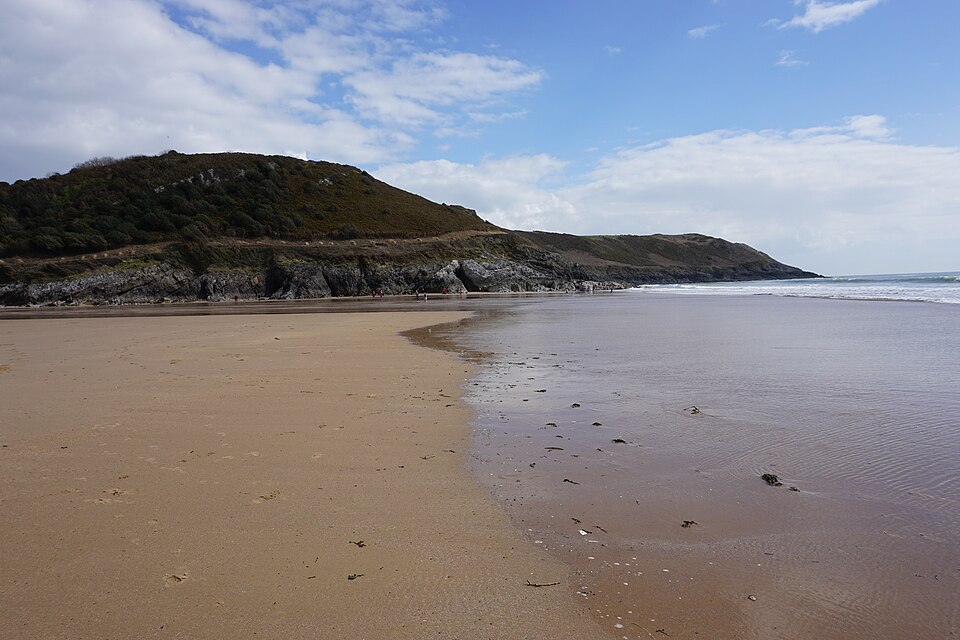 Caswell BayMumbles · faces S
-
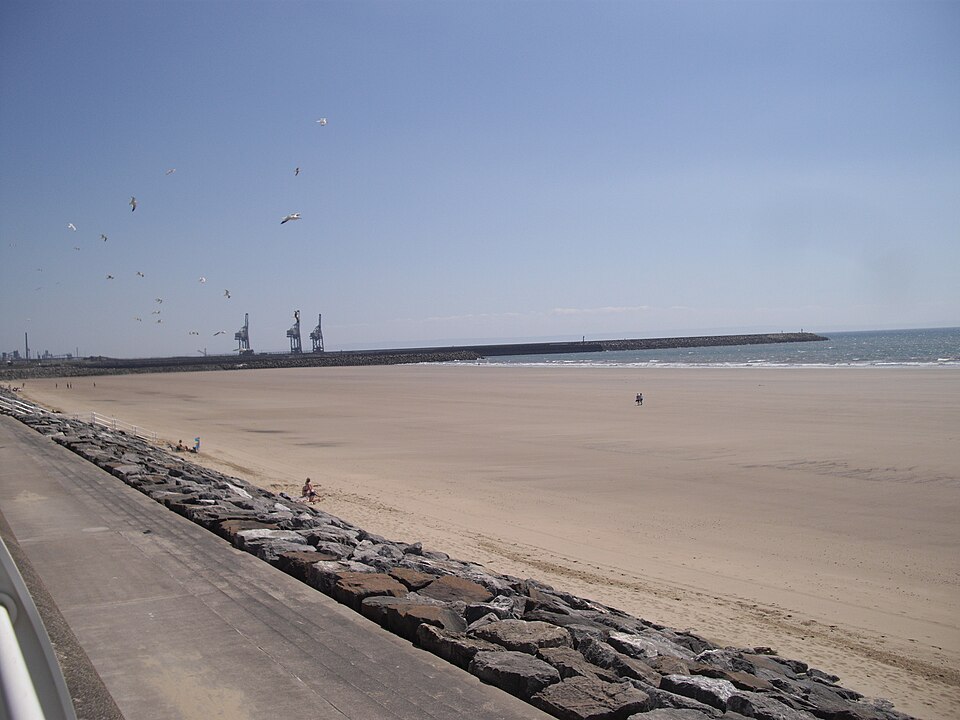 Aberavon beachPort talbot · faces SW
-
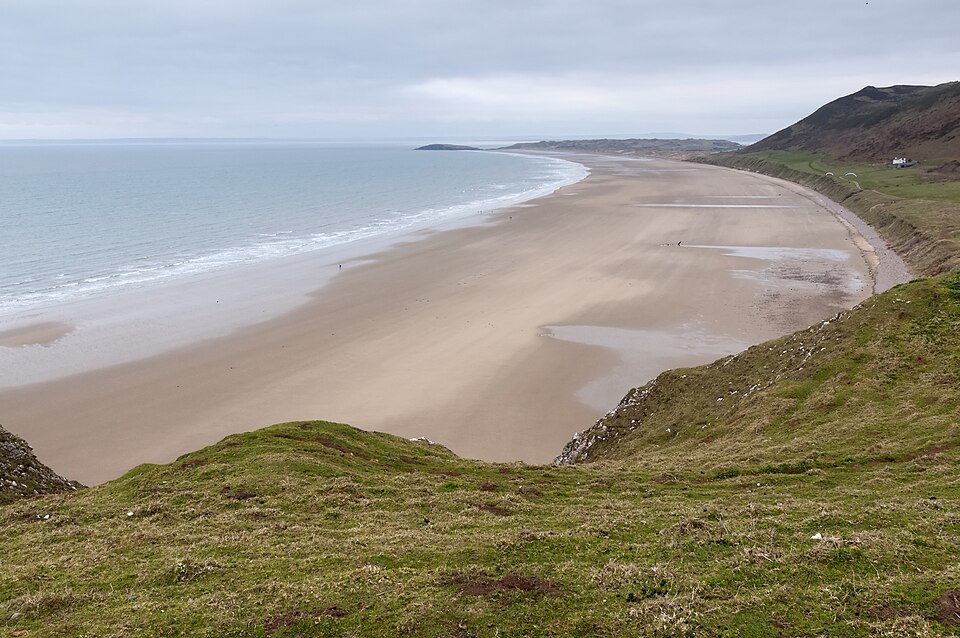 Rhosilli BayGower Peninsula · faces S
-
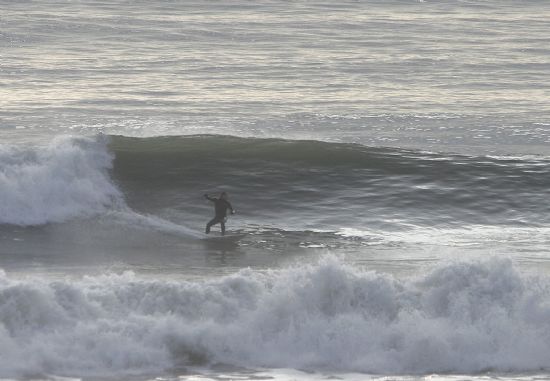 LlangennithLlangennith · faces W
-
 rest bayPorthcawl · faces SW
-
 Coney beachPorthcawl · faces SW